Coffee / Brazil EUDR evidence

EUDR evidence for coffee from Brazil.

Brazil is the world's largest coffee producer, and its coffee often passes through farmers, cooperatives, warehouses and exporters before reaching the EU. Each lot must stay linked to the plots where it was grown. Bosqio brings plot locations, forest-loss checks, Brazilian land and company records, producer documents and follow-up evidence into one traceable record.

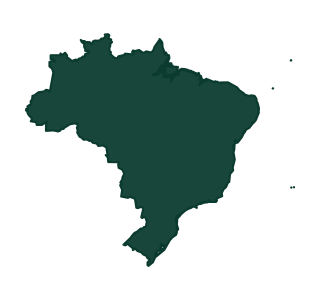
Brazil country boundary
Brazil / Coffee EUDR guide

What matters for Brazilian coffee.

Brazilian coffee due diligence depends on a clear link between each coffee lot and every plot that contributed to it. The main evidence combines the 2020 forest baseline, later land change, regional coffee context, land and embargo records, company records and producer documents.

Maps and satellite signals provide context rather than a simple pass or fail. Coffee shade, cloud cover and seasonal changes can make individual images harder to understand, so conclusions depend on several dates and evidence sources.

Brazil: standard risk - full due diligence still applies Lot-to-plot traceability Forest, company and legality context
Benchmarking note

Brazil is classed as standard risk under the EU country benchmark. This is not a pass or proof of compliance for coffee from Brazil. Operators still need to collect the required information, assess risk, and follow up until any identified risk is negligible.

01 / Coffee

Brazil's coffee landscapes

Brazilian coffee is spread across very different landscapes. Minas Gerais and São Paulo are major arabica regions, while Espírito Santo and Rondônia are strongly associated with conilon and robusta; Bahia includes both production systems. This regional picture helps explain differences in shade, tree cover and seasonality, and gives the declared origin useful context.

Arabica and conilon regions Different production landscapes Origin in regional context
02 / Deforestation

Forest loss after 31 December 2020

Brazil has a long history of deforestation, especially in the Amazon and Cerrado, which makes the timing and location of land change important for agricultural supply chains. For coffee, the key question is whether forest loss or conversion occurred inside a supplied plot after 31 December 2020. Nearby change adds context, while older loss does not by itself make a coffee lot non-compliant.

Inside-plot change after the cutoff Nearby change as context Supporting evidence for alerts
03 / Legality

Land, company and legality context

Coffee can change hands several times between farm and export, so land status and company identity matter alongside the satellite record. CAR data helps place the rural property, while IBAMA embargoes and protected or traditional territories add legal context. CNPJ records identify cooperatives, exporters and other companies and can be matched with official labour enforcement records. A record match may need closer review, but a CNPJ alone is not evidence of wrongdoing.

CAR and plot-boundary context Embargoes and protected areas CNPJ and official labour records
04 / Satellite imagery

See what changed and when

Bosqio helps you understand what happened on and around your coffee plot. Bosqio's own satellite data pipeline brings the newest available observations and alerts together with historical imagery to build a clear time series. You can see what changed, when it happened and whether the signal appeared inside the plot or nearby. The yearly views below make the EUDR cutoff easy to explore, while new data, including same-day observations when available, keeps the picture current.

Newest available observations Clear time series for your plot Change inside or near the plot
05 / Vegetation and radar

Vegetation and radar signals over time

Brazil's coffee regions often have seasonal cloud cover, and shaded coffee can be difficult to read in a single optical image. NDVI shows vegetation patterns, while Sentinel-1 radar adds information through clouds. Together, the signals help separate normal seasonal variation from a more lasting change in vegetation or land cover.

Vegetation patterns over time Radar context under clouds Shade and seasonal variation
06 / Spatial change

Spatial change and supporting context

Not every change in a satellite signal is deforestation. Harvest, pruning, dry weather and image noise can all change what appears on the map. The strongest clues are where the change sits relative to the plot, when it began and whether it remains visible in later observations.

Location relative to the plot Timing and persistence Supporting evidence where needed